Vanity sales metrics look nice.
But they don’t pay the bills ⬇️
What really drives growth?
Tracking the right performance, not just any performance.
Most sales teams get buried in dashboards.
They’ve got data, but no direction.
There’s a flood of numbers, but no real clarity.
They measure activity without understanding impact.
They track everything except what actually moves the needle.
The result?
Missed targets, wasted time, and unclear priorities.
If you want to grow revenue, retain clients, and
sharpen your sales strategy, focus on these
three KPI categories:
→ Sales Performance
The outcomes that directly affect your bottom line.
These are the numbers that show whether the strategy
is working or not.
→ Efficiency Metrics
How effectively your team turns time and effort into results.
It’s about doing more with less, without burning out or losing steam.
→ Customer Engagement
Your connection with the buyer, post-sale and beyond.
How well you’re building relationships that last, renew, and expand.
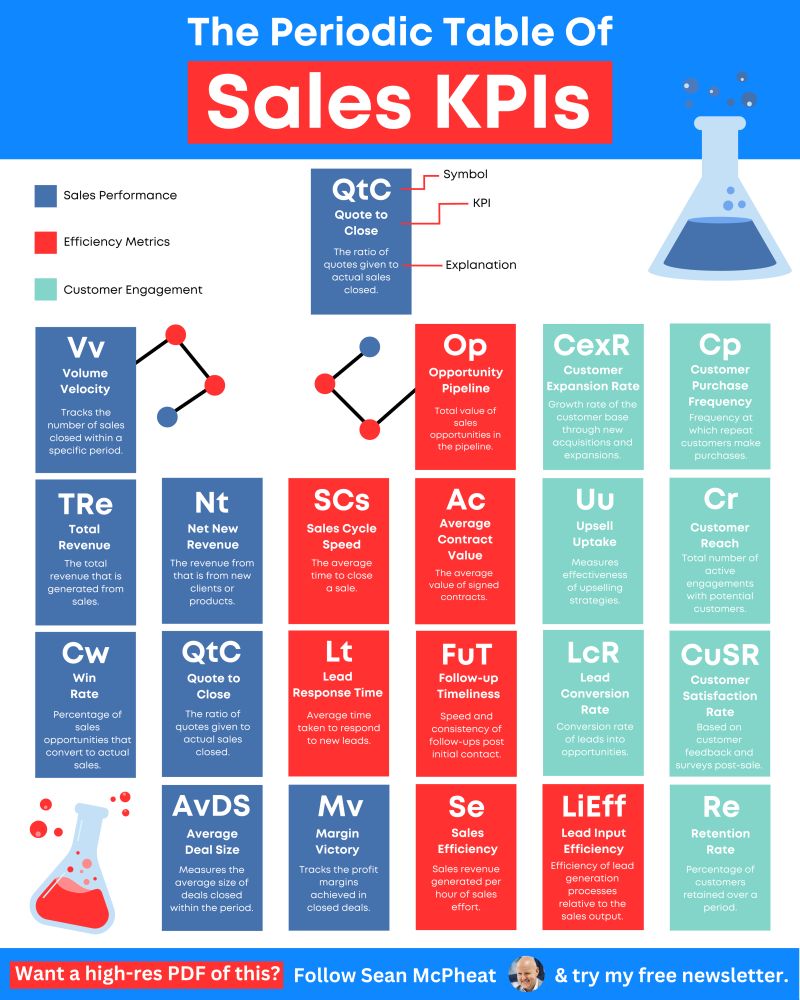
Here are a few underrated KPIs that bring real insight:
→ Vv – Volume Velocity
How many deals you’re closing in a set timeframe.
→ QtC – Quote to Close Ratio
How often a proposal turns into a signature.
→ SCs – Sales Cycle Speed
How quickly leads become customers, speed matters.
→ Mv – Margin Victory
How profitable your deals are after discounts and costs.
→ Ac – Average Contract Value
The average value of each deal signed.
→ Se – Sales Efficiency
Revenue earned per hour of actual selling time.
→ CexR – Customer Expansion Rate
How much new business comes from current accounts.
→ Uu – Upsell Uptake
How often clients accept an upsell.
→ Cr – Customer Reach
The breadth and frequency of your outreach and follow-up.
→ CuSR – Customer Satisfaction Rate
A clear signal of future loyalty, retention, and referrals.
🧠 Remember; Metrics shouldn’t just look good,
they should mean something.
Track what matters. Drop what doesn’t. Lead with focus.
The Periodic Table of Sales KPIs